Photovoltaic (PV) risk analysis serves to identify and reduce the risks associated with investments in PV projects. The key challenge in reacting to failures or avoiding them at a reasonable cost is the ability to quantify and manage the various risks. There are several interpretations of the concept of risk, but in general risk can be defined as the probability of failure multiplied by the consequences of its failure.
Best practice guidelines to improve the operation of PV power systems are often only applied as long as the recommended actions have advantages for the executors, the Engineering, Procurement, Construction (EPC) and Operation and Maintenance (O&M) companies and for the investors whose main interests focus on low risks and maximum profit from an economic point of view. This leads to the key question: How can you demonstrate the effectiveness of measures and justify their application? Because the technical best solution is not always the economic best solution. And before you are able to evaluate the cost-benefit ratio, the following question arises: How to quantify the basic impact of technical risks on performance and reliability?
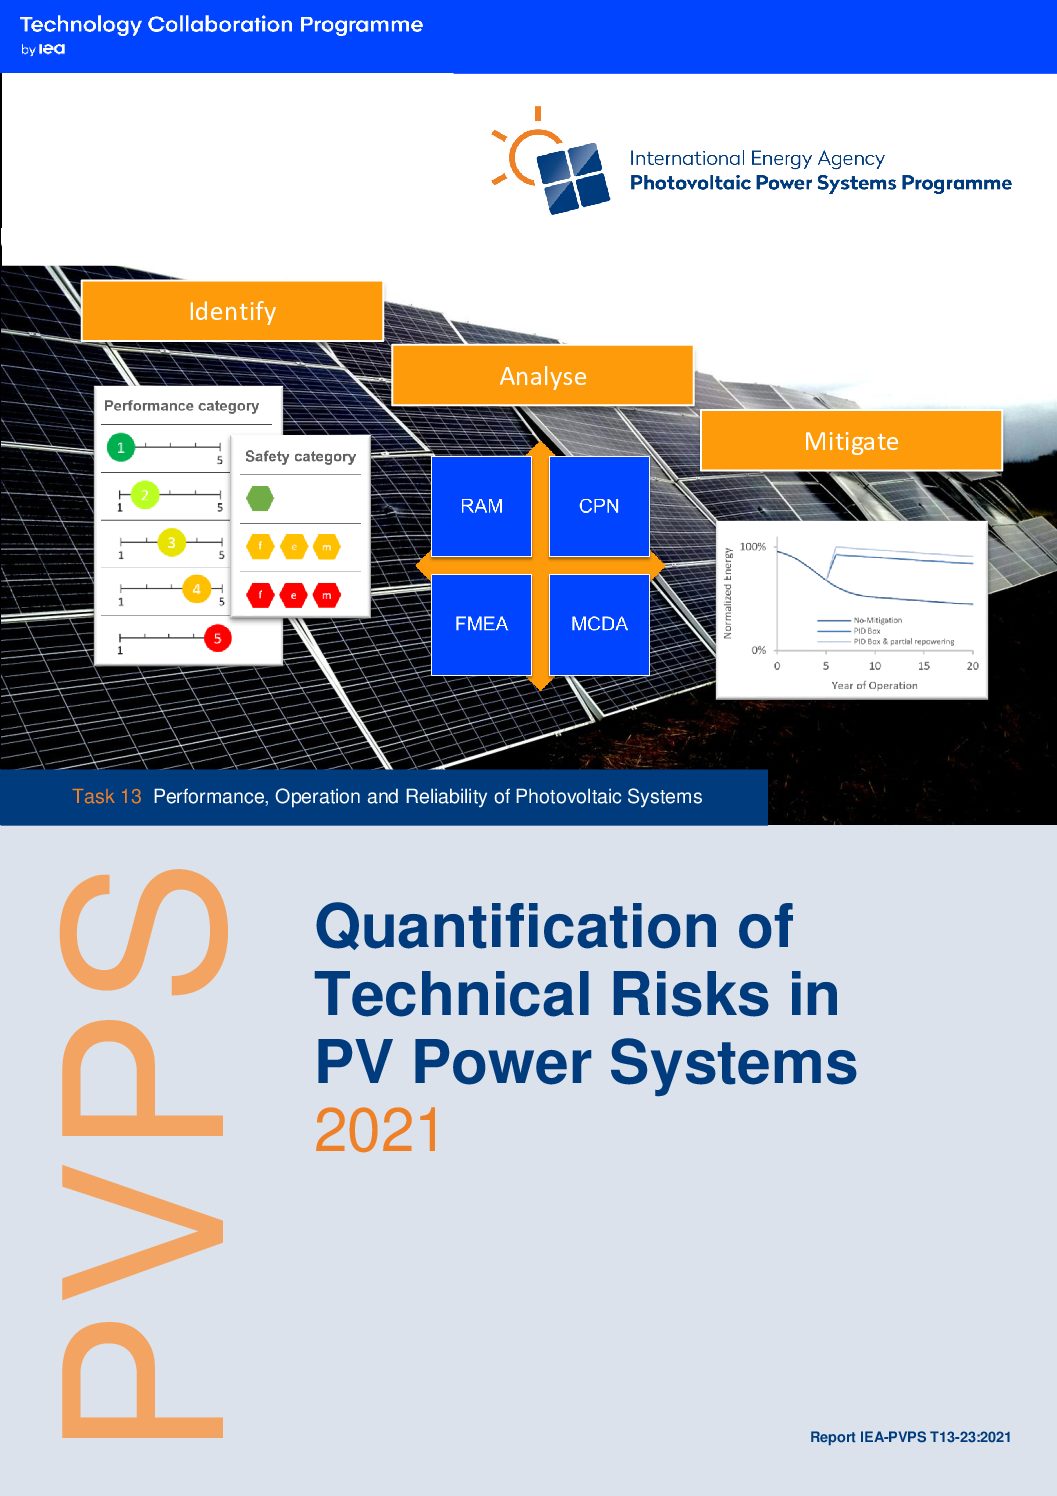
In a first approach we reviewed scientific literature and technical reports to compare and assess the common practices for quantifying the impact of technical risks. Limitations and challenges were compiled and selection criteria defined for the four methods:
- Failure Modes and Effects Analysis (FMEA)
- Multi Criteria Decision Analysis (MCDA)
- Reliability, Availability, and Maintainability (RAM) analysis
- Cost Priority Number (CPN) method
The advantages and disadvantages of these methods are demonstrated considering the factors maturity level and data availability, and as well an overview of common risk mitigation measures is given.
The second part deals with 30 PV Failure Fact Sheets (PVFS) annexed to this report which summarise some of the most important aspects to know about single failures. The target audience for these PVFSs are PV planners, installers, investors, independent experts and insurance companies or anyone interested in a brief description of failures with examples, an estimation of risks and suggestions of how to intervene or prevent these failures. Besides the PVFS collection we used a PV Failure Degradation Sheet (PVDS) as introduced in [1]. These requires much more detailed measured input data but are able to provide statistics on degradation rates and power loss of PV systems based on failure types. Compared to the survey structure in [1] we added two new failure categories for PV modules: Light and elevated temperature induced degradation (LeTID) and potential induced delamination.
These statistics serve as a basis for risk models, such as the CPN method [2] [3], which are used to assess the associated risk and the economic impact over the project-lifetime of a PV plant. In addition to the knowledge of the individual risks, the economic impact of these risks are driving factors for further analysis and decisions. In a final step the costs of mitigation measures are included in a cost-benefit analysis in order to derive the best strategy from a technical and financial perspective.
The revised CPN approach is presented through an exemplary calculation of individual CPN values. The CPN approach was applied to 191 maintenance tickets of a PV plant located in central Italy which is in operation since 2013. The maintenance tickets were analysed manually, corresponding to all the planned and corrective activities carried out in 2018 for the example plant. The improved CPN methodology has been applied manually to this case study, which led to important improvements, especially in terms of the structure and standardisation of the CPN table. We conclude that the development of an automated, and therefore time-efficient, solution for extracting key parameters from maintenance tickets is of vital importance for the implementation of this methodology at the portfolio level, and thus, to gain statistical insights from a large number of PV plants.
In a second case study the CPN method was also applied to a 10 MWp PV plant. As one of the main risks for the PV modules, potential induced degradation (PID) was selected. Taking Capital Expenditures (CAPEX), Operational Expenditures (OPEX) and annual revenues into account, the project’s financial profit after 20 years of operation was 48% below original expectations. Considering the additional costs of mitigation measures, the loss on the cumulated financial income after 20 years of operation could be kept at only 5% – 6% below the originally expected profit.
Cleaning routines for PV power systems in desert regions are a typical corrective measure to reduce energy yield losses due to soiling. The impact of different cleaning procedures on the soiling losses over one year are calculated and shown for a 10 MWp PV plant near Abu Dhabi. In the case of periodic (monthly) cleaning, annual energy losses due to soiling are reduced from 30% to 4% including the costs of 12 cleaning routines. The best economic results are achieved with “triggered cleaning” at a soiling loss of 5%, even if 20 cleaning routines per year are required. The calculations showed how it is possible to determine the best economic solution for a specific PV plant, loss scenario and mitigation approach.
With the provided overview of quantification methods, we draw the conclusion that more standardisation is required. Risk definitions are not fully structured and event databases (solar logbooks) are not harmonised. The development of a software tool for field technicians is recommended that would allow the precise and error-free recording of standardised parameters for the calculation of the O&M contractor’s Key Performance Indicators (KPI) necessary for efficient implementation of the methodology [4]. In summary the O&M field practices must certainly move away from the manual input of tickets in text format and adopt a more standardised approach where human intervention is limited.
All things considered, we believe that the data-driven evaluation and modelling of techno-economic performance indicators is a significant key to take decision support on Levelised Cost of Electricity (LCOE) to the next level.