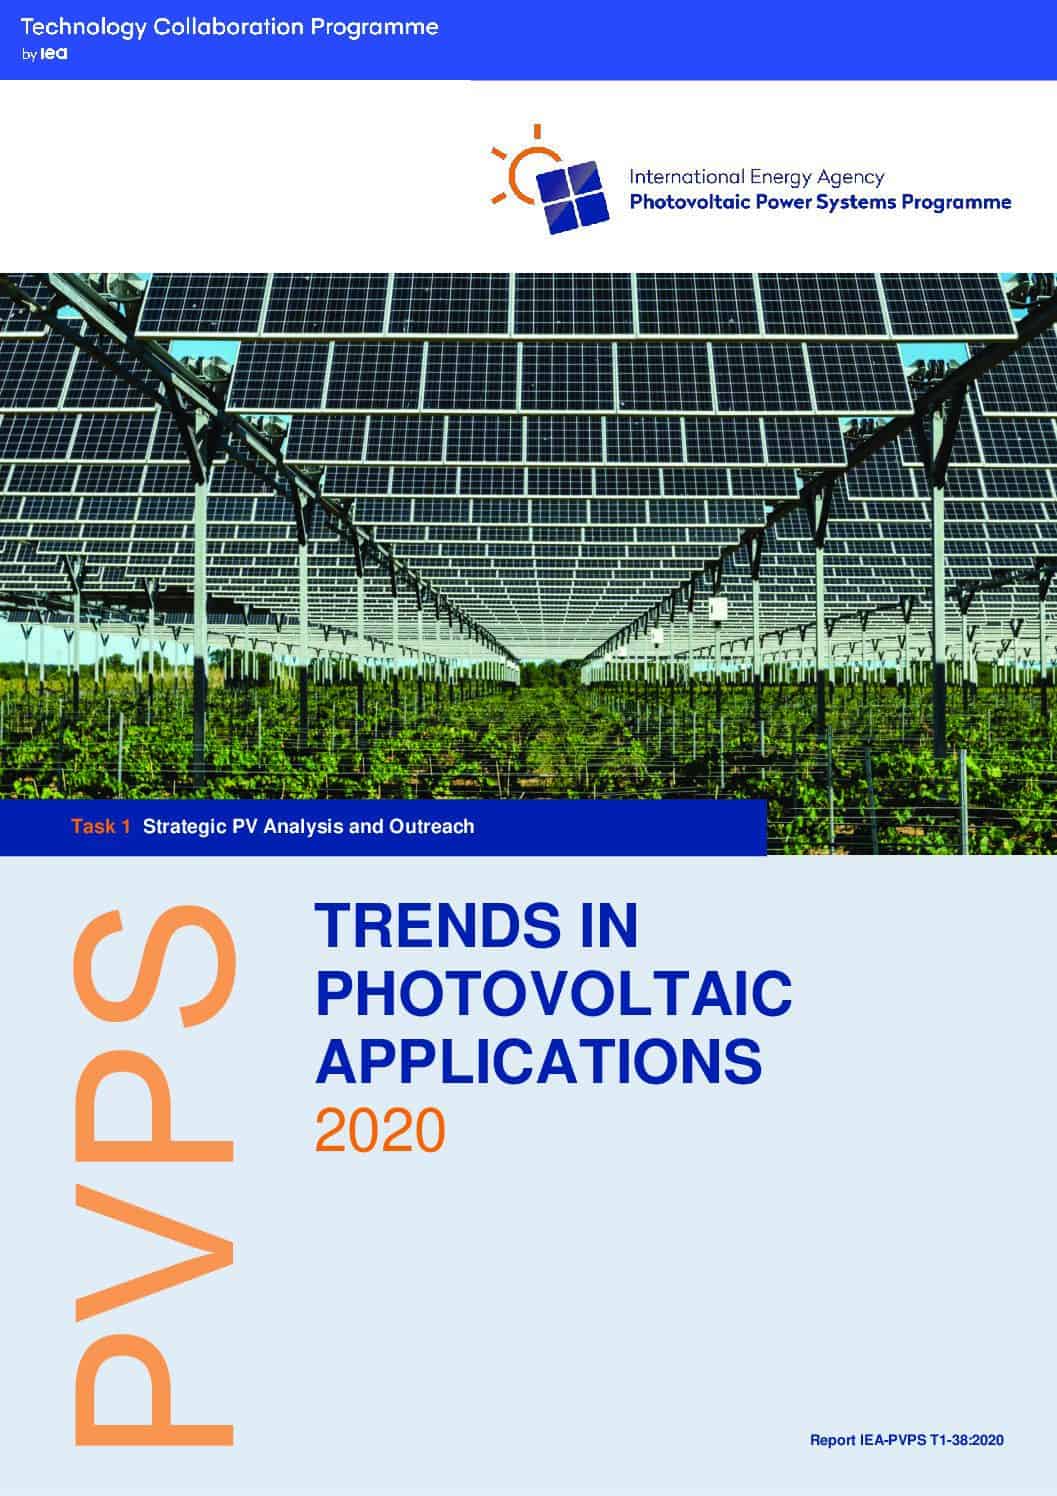
This new 2020 edition of the IEA PVPS report Trends in Photovoltaic Applications browses 25 years of PV installations in the IEA PVPS member countries and many others. Policies to support PV deployment, industry development and the integration of PV in the power sector are analyzed in-depth.
Outline
With 111,6 GW of global installations in 2019, the PV market is still leading the renewable energy transition in terms of added capacity.
The cumulative capacity reached 623,2 GW at the end of 2019, representing a PV penetration of 3,3%. Despite the very impressive track record of PV installation rates in the last years, these figures
are still largely insufficient with regards to the Paris Climate Agreement.
The cost reduction evolution of PV technology enabled a larger and more sustainable market uptake. Nonetheless, national integrated energy and climate plans and international collaboration are required to accelerate the energy transition and to reach less
accessible markets segments for instance.
Overall, the main PV development trend observed in 2019 was similar to 2018 and even more pronounced: a Chinese market slowdown (a 14,0 GW market decrease compared to 8,6 GW market decrease in 2018) which was again counterbalanced by
the (re)emergence of several markets. This uninterrupted market growth of the global PV market year after year is encouraging investments in both upstream manufacturing and downstream installation segments.
The acceleration of the PV roll-out is even more crucial considering the electrification of the transport and the heating and cooling sector. The coupling of local renewable electricity production to both domestic and industrial energy demand is key
to decarbonize the other sectors traditionally relying on fossil fuels consumption. Consequently, PV production should increase even faster to meet the increasing demand for electricity.
The market dynamics were very diverse in Europe: several European markets reconnected with growth after several years of market stagnation (Austria, Belgium, Germany, Italy, Portugal, Spain), others stayed stable (Denmark, France, Switzerland) or
steadily increased (the Netherlands, Norway, Sweden) while other markets started their development more recently (Poland, Russia, Ukraine). In the Asia-Pacific region, Vietnam is the main newcomer next to established markets (Australia, India, Japan,
Korea and Malaysia). In the Americas, growth was driven by the same major markets as in previous years (Brazil, Mexico, United States). In Africa, most of the new capacity was installed in Egypt and to a lesser degree in South Africa, while in the Middle East
the main markets in 2019 were the UAE, Israel and Jordan.
Recently, the most competitive tenders are below 14 USD per MWh and further important cost reductions are still expected until 2030. While these extremely competitive prices are not representative of the average PV installations, the overall PV
competitiveness is still expanding, hence paving the way to new market segments without any form of financial incentive.
The cumulative PV capacity installed at the end of 2019 allows to avoid 700 Mt of CO 2 eq emissions yearly. This contributed to the flattening of the global CO 2 emissions after two successive years
of increase. The global CO 2 emissions are expected to decrease in 2020, due to the impact of the sanitary measures for the COVID-19 pandemic. However, this reduction is not likely to last if the economic activities return to their normal pace. As mentioned above,
a broader decarbonization of the energy sector and of the economy is needed to achieve rapid and sustainable CO 2 emission reductions.
